Active Now

Danilo_G
Discussion » Statements » Rosie's Corner » Ho hum. Pence caught in a lie? Said Oklahoma is "flattening the curve" in advance of the trump ego hate rally planned. Is it really?

Ho hum. Pence caught in a lie? Said Oklahoma is "flattening the curve" in advance of the trump ego hate rally planned. Is it really?

Or is it just another ordinary typical standard everyday lie all trump subordinates tell to cover his a** when he does bad?

What matters it to us? One lie is the same as another lie which breeds more lies which spread even more lies. Pandemic of lies? Of course it is.
Posted - June 17, 2020

Responses


  • 34632


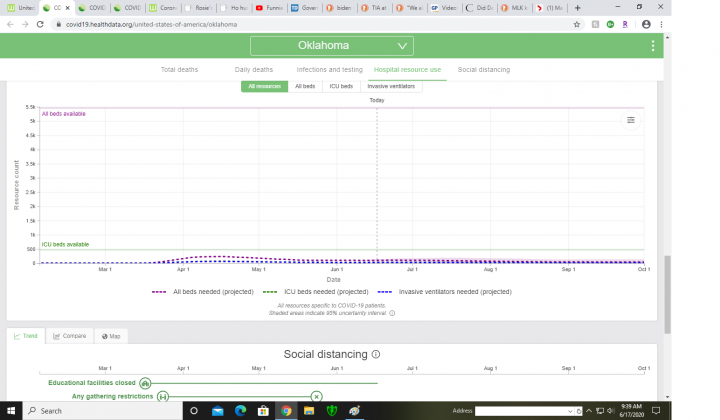
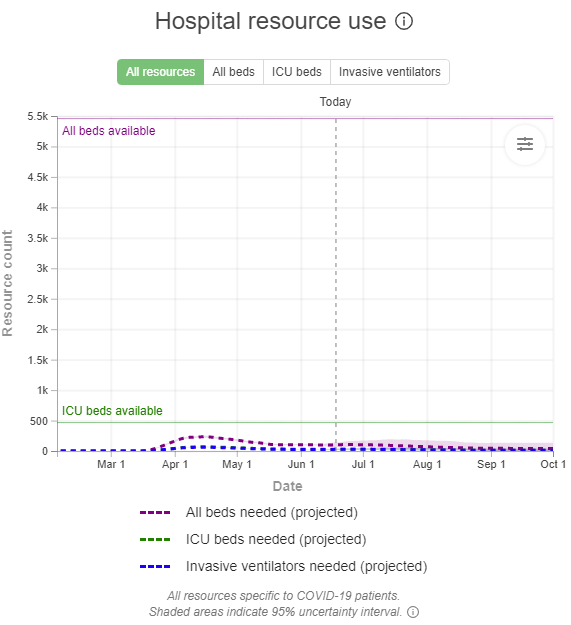
    "Flattening the Curve" was/is about hospital resources.  


    Looks pretty flat to me.  (I zoomed in so as to make the graph easier to see but is the same graph as above)

    https://covid19.healthdata.org/united-states-of-america/oklahoma

    Graph is from  Institute for Health Metrics and Evaluation

     
    This post was edited by my2cents at June 18, 2020 11:01 AM MDT
      June 17, 2020 8:41 AM MDT
    0

  • 19937
    I can't see the dates on your graph, but this is the information I found which covers the period May 20 to June 16 and, as you can see, there is an uptick, not a flattening in Oklahoma.  

    https://nondoc.com/2020/06/17/understanding-covid-19-numbers-the-data-behind-oklahoma-bump/

    The graph below shows the rolling seven-day average of new cases nearly triple over the past 17 days, from that May 30 low to a new high of 183 new cases per day on June 16.   


      June 18, 2020 7:07 AM MDT
    2

  • 113301
    I didn't know to what you referred L until I saw the response from m2c. I can't read it either. Thank you for providing the graph and the link. I have no idea what her graph shows since it's too small to read or the source and I wonder if she will tell you she was wrong and after further research she will tell you that your graph is accurate. One can always hope! :)
      June 18, 2020 7:22 AM MDT
    2

  • 34632
    I gave the link. 
      June 18, 2020 8:13 AM MDT
    0

  • 34632
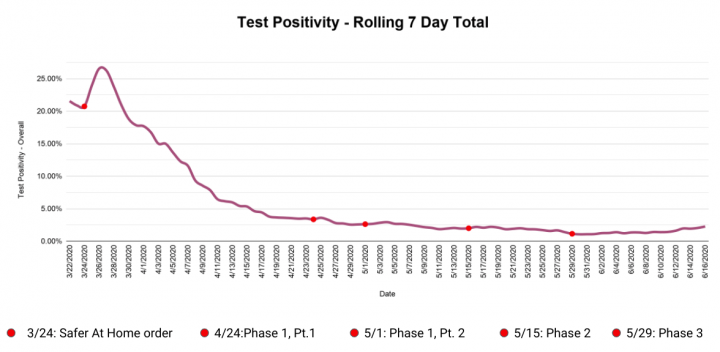
    Thank you for the link.  I prefer numbers from averages and percentages.    But as your link showed the positive percent is staying below 5% of the testing. Which was one of the numbers Dr Birx said they watch for spikes.   (Actually---May 15 4.7%, Jun 1 3.7%, Jun 15 3.8%) They are also now testing asymptomatic people.   Your article also shows that the number of hospitalized has only slightly increased. (May 15--75/45 ICU, Jun 15--98/58 ICU)

    "the Oklahoma State Health Department reported 32 percent of our ICU beds available on May 15, followed by 31 percent on June 1 and 32 percent on June 15."

      June 18, 2020 8:13 AM MDT
    1

  • 19937
    Your chart only goes to May 29.  Mine goes from May 30 to June 27.  You are missing the point.  The point is that the number of cases has increased, not decreased.  Whether or not someone is asymptomatic, they are still testing positive for Covid-19.  Irrespective of how many ICU hospital beds are available, the number of cases being diagnosed is rising.  It just means that the cases are not severe enough for ICU admission - not that they don't have the virus.
      June 18, 2020 10:03 AM MDT
    1

  • 34632
    Counting the asymptomatic is like comparing apples and oranges.  My Chart under my answer goes to Jun 13.

    My chart above goes to Jun 16.  Your chart stops also at Jun 16 (June 27 is not here yet)

    Hospitalizations are steady.    According to Fauci, we worry about a spike when there is BOTH an increase in cases, hospitalizations and percent in Positive tests.   Yes we have more cases but we do not have a significant increase in hospitalizations nor in percent of positive tests. 
      June 18, 2020 10:28 AM MDT
    0

  • 19937
    June 27 was a typo.
      June 18, 2020 11:16 AM MDT
    1

  • 113301
    :):):)
      June 18, 2020 11:56 AM MDT
    0

  • 13277
    The old saying, "Figures lie and liars figure" comes to mind.
      June 18, 2020 8:30 AM MDT
    1